As 2020 is around the corner, I take some time in this article to go over some of the statistics concerning me and the blog over this past year. Much like last year I will be going over the statistics of the blog, detailing the best articles of the year, and some other things that are logged by WordPress, such as where all my views are coming from. New this year is also a paragraph on the development of the Patreon page, which has grown out of proportions compared to last year. Finally, the article will cover my personal playthroughs of this year, for which I have created a new system to keep track of all my playthroughs. While they aren’t stored in a public place, I can share some statistics of what quests I have played most, and what my win-ratio was this year. Since I do this every year, I would love to see what the stats are from other people, so that I can compare my results a little. But before we cover that, let me just say thank you to everyone who has visited the blog this year. I hope you learned from it and that it has helped you in your playthroughs.
Have a good 2020 everyone and I hope you get a lot of great games in!
Blog
2019 vs 2018
We start this part of the article with the total number of views, visitors, likes, and comments that the blog has had during 2019. Compared to 2018, there has been a massive influx in traffic on the site thanks to an ever-expanding community and more articles that relate to older articles, causing views to increase. Where 2018 had just short of 50k views (49,363), 2019 blew past that in a matter of months. In April we had already passed the 50k and were cruising towards a new record. In September, the 100k mark got reached, and by the end of the year, the total view count has reached past 141k, which is nearly triple the views of last year!
The visitor count increased accordingly as well, with the 2018 number of visitors ending up at 12.5k, but 2019 surpassed that and the blog went on to reach 32k individuals that watched the site (counting the same visitor only once per day). Comparing this with the total views, means that the average visitor looks at 4.41 articles in 2019 on the blog per visit, while that number was just 3.96 in 2018.
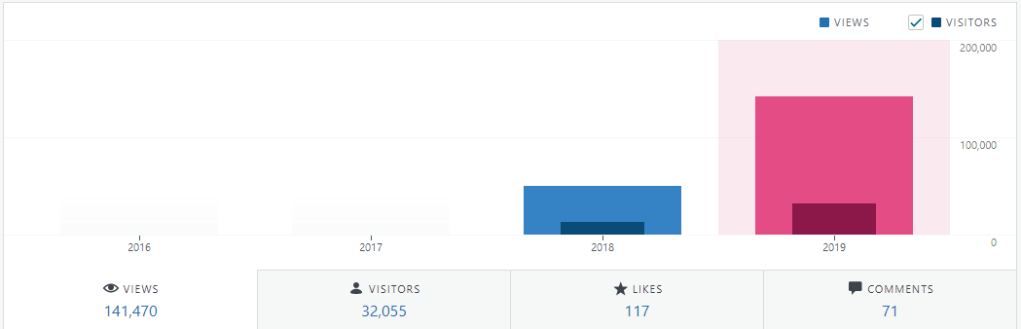
The likes of the articles have decreased since 2018, from 190 to just 117. I don’t really care too much about article likes, since many of them are placed by bots that find the articles while browsing WordPress. Still, I do like to see the notification on my phone each time someone managed to read the entire article and pressed the like button.
Comments are far more precious to me, and I like how that number has increased from 42 to 71 during this year. Most of the comments are filled with wonderful feedback and things that I might have missed during the article itself. I do move the discussion away from these comment sections and into Discord, Facebook, or the forums, so these 71 comments are mostly individual threads.
Stats per month
The increase in traffic on the blog appeared early in the year, when records were starting to get smashed each month with more and more views. The first real peak was in March, when I had a lot of spare time working on the blog and pushed a lot of articles out. From there, I had tons of time during my graduation to do small tweaks on the articles and work on the blog from behind my computer while experiments were running. This led to a constant 11k+ views during the summer, which is a streak that I have yet to break. This meant a very steady stream of at least 300 views per day, with regular peaks whenever a new article was released. This shows that there really is a constant interest in LOTR LCG content and that time of day or day of the week doesn’t really matter that much. There wasn’t a big increase in views during the weekend or anything.

As for my best day, that was the 2nd of June this year, when the blog received 1343 views in a single day. Back in 2018, that would be enough for a month’s worth of views in a single day! That day, I posted my Levels of LOTR LCG Players, which received nearly half of those views. Other articles also did well on that day. So there was a ton of interest in that article, which caused the daily statistics to blow up!
Articles
In total, 2019 has seen the release of 78 articles by myself. These weren’t all written by me directly, as around 9 of these articles include Storage Solution articles that were very little work for me. These 78 articles also do not count the 48 articles written by my team of co-authors. These people carried the blog during the summer as well, which meant that my attention could be placed elsewhere. This means that in total, the blog has produced 126 articles before the release of this article. Since I intend to wrap up this month before the end of the year, I will put that number at 128 articles produced this year. This is an amazing amount of content, with around one article every 3 days for the community to enjoy.
In terms of views, these are the top 5 new articles that were released this year:
- Levels of LOTR LCG Players : 1738
- Storage Solutions: Dave Walsh from Card Talk : 1700
- Player card Analysis, Leadership Sphere Core Set : 1206
- The Battle of Carn Dum : 1119
- “Best” LOTR LCG Packs to buy : 903
I’m amazed at how many articles from other creators are on this top 5 list. The two articles I did myself were very entertaining to the community and will no doubt continue to be relevant in the new year. Speaking of which, let’s see the top 5 articles from last year that received the most views in 2019!
- Storage Solutions II : 1797
- Silvan : 1668
- Dwarves : 1187
- Rohan : 1154
- Noldor : 1086
Lots and lots of archetype analysis articles managed to remain relevant in 2019 it seems. This makes me want to review more archetypes, but I’m afraid I have covered nearly all of them as of right now. I will continue to update the articles that receive new cards to keep them accurate with this increased cardpool, and will hope to see these articles continue to do well in 2020.
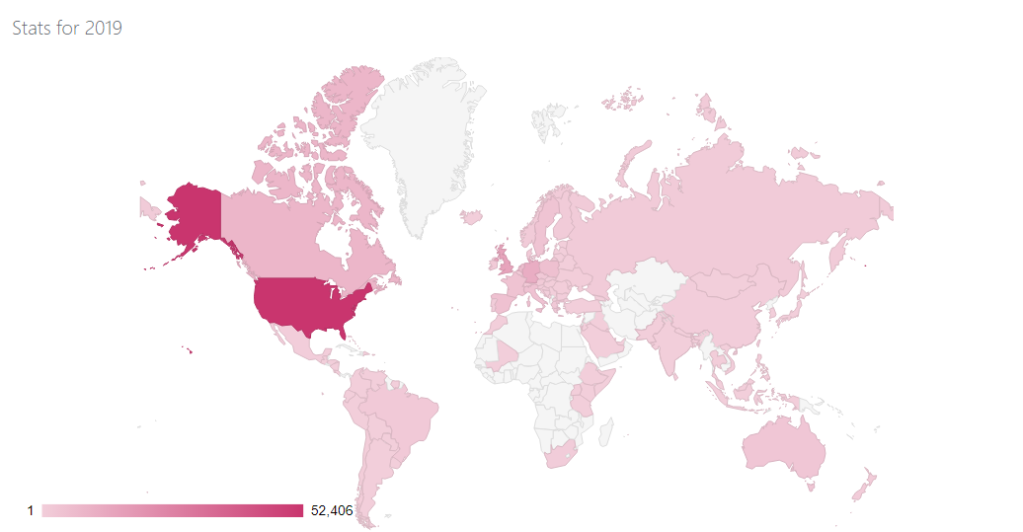
Countries of origin
All those thousands of visitors had to come from somewhere, and luckily, WordPress allows me to see from what country the visitors are. This allow me to build up a top 10 countries with LOTR LCG players who are frequent visitors of this site. In total, there were visitors from 107 countries all over the world. This number does include some territories that WordPress recognises as individual countries instead of their actual nation. Examples are the Channel Islands and the European union for some reason. Here is the top 10:
- United States (makes sense, largest English nation and FFG headquarters)
- United Kingdom (Again, major English nation and Tolkien headquarters :p)
- Germany (A lot of boardgamers there, go visit Lure of Middle Earth if you can!)
- Canada (Many English natives and many boardgamers as well)
- The Netherlands (Since my articles are published from NL, they are seen by many from here as well, generally not as many views per visitor)
- Poland (There is a surprisingly large Polish community out there for this game)
- Spain (I have seen links to my site from Spanish blogs as well, that draws a crowd)
- Italy (Another major European country with plenty of players, though I don’t know any of them).
- France (Plenty of French players that don’t have many French blogs to enjoy)
- Australia (Again, many English players there looking for a blog)
Here is an overview of the entire map with the countries coloured in if they visited the blog this year. More people countries in Africa this year, which fills out the map nicely.
Referrers

Most of these views come from people who click on the promoted articles that I put out once an article goes live. It is tracked how people access the site, so that I can improve my marketing a little. The following list of websites show where people are clicking from to the blog. Note that this does not include Discord, which would account for a lot more clicks if that was also tracked.
The main method of accessing the site seems to be the regular search engines, which is how many new players also manage to find my guides. After that, the articles that I post in Facebook draw a pretty big crowd. I have promised to post a little less in that group as to not overwhelm everyone, but it is one of the most effective ways to reach a 3000+ audience. After that, the forums of both FFG and BGG are next. While I don’t post on BGG, some of my co-authors do, which in turn drew a crowd to the site over the last year. Clicks through Twitter are also very common, as I post there every time a new article goes live. Following me there allows you to keep up to date with the latest articles. Hall of Beorn clicks also pop up, eversince Beorn himself started to link fan-content for scenarios and archetypes on his search engine. This links directly to my guides, and creates more interconnectivity. Besides some other WordPress apps, we arrive at Reddit. I’m not on Reddit myself, else I would also be flooding the subreddit there with my content. Instead, the 149 clicks from there are thanks to people linking specific articles, usually centered around storage.
Clicks

It is also tracked what links are clicked on when you are on the site. These external links can link to places where storage solutions can be bought, or it can link to other blogs etc. The following links were clicked on the most in 2019.
Of course, Hall of Beorn got the most clicks, since I tend to link as many cards in an article as I can. As for what cards were searched for the most from my site, that would be the following top 3:
- Out of the Wild: 129
- Elrond’s Counsel: 124
- Rally the West: 118
The spread is pretty close together, so nothing really stands out. In second place, my own site got the next most clicks. This involves links to previous articles that I linked in more recent ones. Of these, Passage through Mirkwood is the most clicked article, as it gets linked a lot for those people who need an example of an easy quest. RingsDB is in third place (and in 9th). These links are commonly found at the bottom of archetype analysis articles in case you need a deck that works with that discussed archetype. The new deckbuilding series on the blog also increased the number of links to RingsDB, and in turn, increased the traffic. The most clicked on decklist is the Swords of the Noldor deck by bgamerjoe. Finally, the group with the fifth most clicked links are the youtube videos of let’s plays that I link at the end of each scenario analysis. These give struggling players something to watch in case they need to see how the scenario plays out. The most linked video from here is actually not a playthrough, but Seastan’s list of terrible treacheries.
Authors
I couldn’t have done all of this content on my own, and I am very thankful for having so many wonderful co-authors to help me out. They created a combined 48 new articles for the blog in 2019, which received a ton of views during the year. The following list is the ranking of which author got the most views on their articles. This is not a competition or anything, as someone who creates a single article during the year that is really popular might end up with the same number of views than someone who cranks out a poorly viewed article more often. The list also includes views on articles that were posted in 2018.

Shocking no-one, I got the most views by far, but that is a bit cheating since I also wrote menus and most of the articles. Other than me, Silblade’s player card reviews have drawn the biggest crowd. After him, Brinx’s saga scenario analyses end in third, despite him only creating a single article this year as he was quite busy. Dragoncymru produced a stream of progression articles for his series at a high frequency, which got a large audience this year. Morten’s articles are next, as he created a fair few scenario analyses on quests that are very tough to beat and thus require a dedicated article that gets a lot of attention. At the lower end of the list, we have some authors that are producing their own content besides my blog. These creators produced only a few articles this year, and have thus not received as many views. But with more articles coming up from most of them, I hope to see them at a higher position in the future.
If you are interested in writing for the blog as well, then feel free to check out this call to arms. There you will find a semi-outdated, but still relevant article on how you can start to write for the blog and get your articles published.
Patreon
New to this year’s article talking about statistics is a section on the Patreon support that the blog has accumulated over the past year. While the support was just a handful of patrons this time last year, the Patreon community has grown a lot during Spring. I had the pleasure of welcoming new members to the community and even had a fair number of higher level pledges. This all led to an increase in income for the blog, which has helped me to keep the blog running and to supply every member with a piece of swag during October. The goal I set for myself of $25 was blown past in a few months, and I even reached the goal of $75, which is enough for me to easily pay the hosting of the site, while also using the rest of the money to save up for next year’s swag.
In total, the blog is currently supported by 17 members of this community, generating $66 per month to keep everything running and to fund other items like swag. I would like to thank each and every one of those patrons for their support and will be repaying them for their service in 2020. If you are looking to help us out by pledging a monthly amount to the blog as well, then check out this link ( https://www.patreon.com/bePatron?u=7631819 ) where you can check out the different rewards!

Playthroughs
As I stated in my article on the scoring system of this game, I track my wins and losses of every playthrough I do. While it usually means writing down the outcome of the playthrough in a book, I did translate the stats to an Excel file where I could do some math and look at my win rate of 2019. I could also see what scenarios I have played this year, and find out what my value of X is, where X is the number of quest you’ve beaten X times.
In total, I got 137 games of LOTR LCG in during 2019. This is a bit lower than last year, when I had 158 games. This is probably due to me having little time to play during the summer while I had my graduation. But 137 games is still a solid number and means that on average, I play a game every 3-ish days. Of those 137 games, 77 ended up with a victory. That leads to a win-rate of 56%. This is better than expected, though I will stress that I tend to play the easier scenarios more often than the more difficult ones. Still, 56% of the time I won, which goes to show that this game will beat me during the other 44%. That means that even with the modern card pool, some quests can still pack a punch.
In total, I played 127 games with scenarios from the regular cycles, 4 from the Saga boxes, 4 from POD scenarios, and 2 Nightmare scenarios. Lucky for me, I won both Nightmare playthroughs, so my win-rate on Nightmare mode is 100%! It served as a great warm-up to Con of the Rings and I do intend to play some more Nightmare in 2020.
Here is an overview of most of my playthroughs and what scenarios I missed out on.


As for my value of X, where X is the number of times you played X quests, mine turned out to be 5. That means that during 2019, I played 5 different scenarios at least 5 times. I couldn’t get to 6, as I only have 2 scenarios that I played at least 6 times this year (Across the Ettenmoors & Voyage Across Belegaer). I hope others can search their logs to find out what their value of X is, so that I can compare my 5 to them. I believe it is a little low, but I might push it to a 6 during 2020.

I hope more people will start tracking their playthroughs and their win-rates in 2020, so that we can compare results at the end of the new year. I wonder if there are people brave enough to play each quest at least once. That would be quite an achievement. To help everyone with this, I have shared my file here, so you can keep track of your playthroughs in your own document if you download it.
2020
With all of 2019 covered, I will prepare myself for the new decade. 2020 will be a big year for LOTR LCG, since it is scheduled to take a break after the official content ends in that year. I do not doubt that the community will endure and I know for sure that I will still have a lot of great games next year, including the new scenarios that should be released to finish the final cycle. As for the plans for the blog, you can check those out in my article on the future of this blog. But rest assured, I do not plan on anything to happen to the frequency of the posts due to this break in content.
2020 will also mark the year that I start to work on an actual job. While I do not yet know the impact that this will have on the articles and my schedule, I will try to keep as invested in the content as ever and am fortunate enough to have a great team backing me up with excellent content of their own. And with so much content left to cover, we won’t stop running out of ideas either.
So happy new year, and I hope to speak to you all soon!

I think your idea of that “Value X” is an interesting way to measure a players gaming activities. I have some of my games logged, so I will compute mine as soon as I find the time. Anhow, you described the value in two different ways. First, its computed from the quests beaten (so only won games, I’d say). Second, games played (regardless of success). As I think the latter option doesn’t punish a players will to try new decks and play more difficult missions (because not only winning counts) that much, that value is more of interest.
LikeLike
I log my games with an app (www.skillen.de/Apps if any interest) of mine. I implemented the Value X (both versions) into it, so here are my numbers for some of the past years – I do not have all years covered:
2014 Value X (played) 4 (won) 3
2015 Value X (played) 7 (won) 6
2019 Value X (played) 7 (won) 5
LikeLike
Thanks for sharing. I haven’t checked what my X value for victories is, but I will be sure to keep a log of those for 2020. I’m already up to X = 2 this month for both values, so I hope to go beyond 7 this year!
LikeLike