
As the year has come to an end, I look back at 2018 as a year in which I have appreciated the game some more. Not only did I attend Con of the Rings and bought every expansion that was released this year (excluding the Limited Edition 2 players set), but the Digital game was also released in early access this year. And then I haven’t even mentioned the fact that this blog was born in the early days of 2018 as well! All in all, a great gaming year to me.
But with the year now behind us, I wanted to look back and talk over some statistics with you. Not only did I keep track of the traffic of this blog, but I also kept track of most games of LOTR LCG I played this year. From the data gathered from over 100 games, I wanted to share some of the conclusions. All of this leads to my request that I would like the rest of the community to keep track of their games over the coming year. This will result into a nice comparison at the end of 2019, as well as a reference for yourself about what quests you have played more, and what your overall win rate is.
So without more talk, let’s dive into some numbers!
Blog
The blog isn’t a year old yet, so all of this data has been obtained between January 21st until December 31st. I thought about doing this once the blog turned 1 year, but I convinced myself that the end of the calender year is a good date to cut this off and reflect on the year itself.
The first thing to look at is the total number of articles published. We have not been idle here and made sure to have several articles published each month in order to catch up to recent content and to satisfy the community itself. At the time of this article’s release, the blog counts 136 separate articles. Of these 136, 112 have been written by myself, while the other 24 were made by my co-authors. I am really grateful for the team of 10 people who have been writing this year for the blog and will (hopefully) continue to do so in 2019. All the words in all the articles combined are estimated by WordPress around 450.000 words in total, given some rounding by me, since I keep adjusting articles and can’t get a straight number right away. The average article contains 3.282 words, which makes it slightly shorter than a standard middle-school essay that I had to write when I was still in school.
In terms of most popular articles, I had to filter out some pages that got the most views (obvious, as they are hubs to separate articles). This resulted in the following list of articles that got the most views:

What I like about this is that the most popular articles tend to be those centered around the community, and not individual quests. Escape from Dol Guldur was the most popular quest articles, which makes sense. Lots of people are struggling with that one, so articles that give tips about scenarios like this tend to get more views. It was also an old article, meaning that it had more time to get views. The bottom of this list consisted out of newer articles that didn’t get time to get views yet, and many month-in-review articles ended up at the bottom. I will still continue these articles, as they serve as reflection for myself, and gives you some spoilers for what is to come in the next month.

The visitors of the blog have also kept coming. In the entire calendar year of 2018, I have had 49.364 views, originating from 12.457 individual visitors. These visitors come from over 70 countries, with the most popular countries being the United States, the United Kingdom, Germany, Canada and Spain. These visitors have also liked plenty of posts, reaching 190 likes this year. You didn’t have much to say in the comments though, only 42 reactions have come in this year. If you spot something in an article that is wrong, please comment below so that I can adjust it. The views grew steadily as the blog grew as well, peaking in July, with 5627 views per month. After that, I got a summer job, which prevented more content in August and September. But as the blog grows, I am happy to see rising view statistics on the dashboard.

Most people visiting this blog came from Facebook, where I often share links to posts I made. Search engines came in second, and Twitter third. Noticeable is that Discord is not registered in this list, but I would be interested to see what the statistics of that app would be. Further visitors came from other LOTR LCG blogs, the community pages, and various other apps.
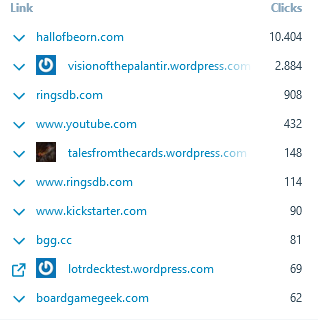
In terms of clicks to other websites, Hall of Beorn took the top spot, followed by links to other articles on the blog itself. This also comes because of a change in web address when I transitioned to a paid blog back in May. RingsDB, youtube, and various other blogs got clicked on as well during this year. Turns out that the most clicked on card from the blog to Hall of Beorn was Out of the Wild, followed by Rally the West and Greenwood Archer.

When looking at what author got the most views on their articles, it makes sense that I should be on top. Not to boast or anything, but I mean, I did make the most articles this year. I am glad to see my other co-authors getting a lot of views on their articles as well. In 2019, I hope to lead the chart as well, but hopefully more authors will appear on the list, and that they all may get more views as well.
That about does it for the blog itself, but I do want to shout-out my faithful Patreon supporters as well. They collectively raised $47,- this year, allowing me to break roughly even on the $48,- hosting costs of this website. Each Patron has been given a piece of VotP swag this year, and I hope to raise enough funds to do the same next year. For 2019, I would love to at least break even on costs again, but if more money would be made, the profits will be put into creating swag or other purposes serving the blog. Any support you can give is appreciated, and you can still reach some tiers, opening up rewards and special influences you can have on the blog. You can find everything about Patreon here.
Playthroughs
Enough about the blog and the raw statistics obtained from it. I have done so much else besides controlling the blog, with one of those things being playing the actual game. After each game of LOTR LCG that I played, I also wrote down some information about the playthrough in a small A6 notebook. The info included what scenario I played, in what mode (Easy to Nightmare, with some variation thrown in), the threat level of my deck after I won or lost, if I played solo or multiplayer, and whether I won or lost of course. With all of this data combined in an Excel sheet, I can now share some statistics of my games of LOTR LCG from 2018. If you want to see the Excel sheet, follow this link: https://www.dropbox.com/s/40ioy6gq9e1qq46/LOTR%20Quest%20Tracking.xlsx?dl=0. You can also adopt this template to score your own games in for next year!
In total, I recorded 157 separate games during the year. Now it is important to stress that I didn’t count all of my losses, that is something to improve on for next year. From all these 157 games, I managed to win 104 games, giving me a win rate of around 66%. Again, this should probably be lower, as the game is very tough.

The different game modes are what makes this game approachable for many players, and between Easy, Normal, and Nightmare mode, the fans of this game have added several other modes to this game as well. Of all games I played last year, I played 66 in Easy mode, 67 in Normal mode, 17 in Sleazy mode, 8 in Nightmare mode, and 1 in Slightmare mode. This was the year where I first got into buying Nightmare packs, so for next year, I would expect my Nightmare level to be a bit higher. I also came to the conclusion that half of the time, I just want a quick and easy game, so Easy mode tends to be my go-to mode.
Other nice general statistics of my games this year is that I played 40 multiplayer (or multihanded) games and 117 games true solo. I don’t have a dedicated playgroup for my physical cards, so I rely on Fellowship events and events like Con of the Rings. Occasionally I will do a multihanded playthrough, but only if I have enough time for that. Another statistic that was interesting was my average threat across all attempts (both won and lost). This came to an average of 36 threat, which is respectable. Some games were really close, but playthroughs of Shadow and Flame or Trouble in Tharbad tend to lower the average threat a little.
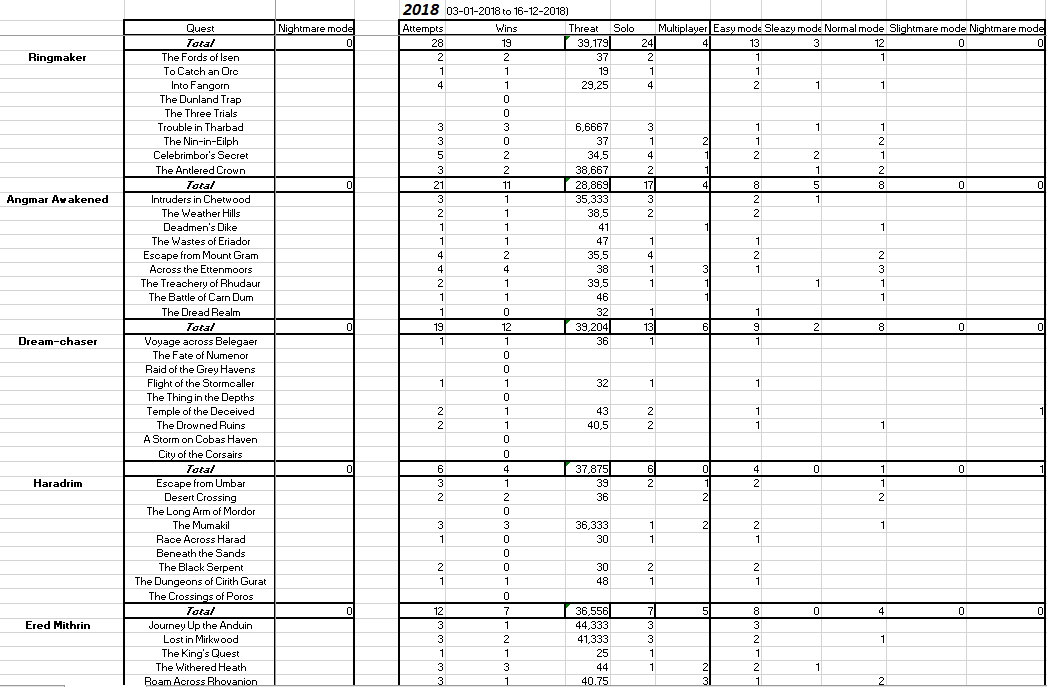
In terms of what scenarios I played, let’s first look at cycles. I played at least one scenario from every cycle, with Dream-chaser being the least popular, at only 6 playthroughs. The most played cycle was the Against the Shadow cycle. This is due to the fact that I covered each scenario from that cycle on the blog, and am fond of playing certain quests in that cycle. Out of all cycles, I only played each scenario from the Angmar Awakened cycle, and the Ered Mithrin cycle (not counting the 3 packs that aren’t out yet). Out of all 102 scenarios in the game at this moment, I played 62 of them, which is decent. I have not played each scenario, as some are more entertaining than others. But I should focus on getting more variety in my plays for the next year, otherwise some encounter cards that I paid for won’t see play for a year, which is a shame.
And for the most played scenario of 2018, the golden medal goes to…..Encounter at Amon Din! I played this quest a lot last year, as it is an easy one if you have limited time or need to test a deck. I also like this quest as an introduction for new players to the game. I won 7 out of 9 attempts, which is pretty good. I will try to diversify my scenarios for next year a little though, so it is good to know that Amon Din should take a backseat to other quests that I played less. The Seventh Level took second place, and Passage through Mirkwood took third place, with 8 and 7 attempts respectively.

When it comes to Saga scenarios and POD scenarios, I played very little of those. I had some luck to play a lot of Saga stuff during Con of the Rings, but as I don’t have a campaign yet, the Saga’s weren’t as popular during last year. In fact, of the Hobbit saga, I only played Battle of the Five Armies last year. I did play both scenarios from the Two Player Starter Set despite not owning the quests. They were a lot of fun, but I only managed to get 1 playthrough on each. The POD scenarios clocked 6 attempts and only 2 wins, showing that these quests are a lot more difficult than the regular scenarios.
And that about does it for my playthroughs of this year. Like I mentioned above, there is a link to the Excel file where you can find the data on these playthroughs. I will try to update the file next year again with all of my playthroughs of that year as well. It will serve as a nice comparison to reflect on your gaming year.
2019
I hope to continue my gathering of information about my playthroughs in the new year as well. But that is not all. I hope that this article has inspired some of you as well to keep track of what cards you bring to the table and how many times your deck bites the dust. I would like to request that you get a little notebook of yourself, and keep track of all games of LOTR LCG you play during 2019. Not only will this serve as a reflection at the end of the year, but we can then also compare the statistics across different players. My notebook strategy worked well for me, but you can also make pictures of your final board states and plug in the data into a file based on those. You can even keep track of different statistics like whether you play on OCTGN or with Physical cards, or maybe what kind of heroes you run in your decks. You can also keep track of the total number of rounds it takes you to beat a scenario, or you can calculate the actual in-game score for each game you play.

I hope many of you will take this information gathering as a new year’s resolution, and that this time next year, we can put our data next to each other and make comparisons. Hope to see your results next year, but for now, have a happy new year!

Uh, funny to see myself on the map there: I am your one visitor from Mali, West Africa! 🙂
A happy new year to you, and I certainly look forward reading you in 2019.
LikeLike
I thought it was someone routing their IP through Mali, but I am glad the blog reaches Africa too! Have a happy new year and I hope you get to enjoy the game in 2019 as well
LikeLike
I don’t know how many people appreciate/enjoy the numbers, but I certainly do! My own personal game tracking spreadsheet is massive…
LikeLiked by 1 person